Maps and other work
Scrollytelling Prototype
Prototype scrolling telling article inspired by the Washington Post.
Finding Opportunity in Rural America
Use this map to find opportunity by layering data onto a map of the U.S. using the following factors
rurality
broadband coverage
higher education
new markets tax credit & opportunity zone tracts
factors 1 through 4 combined
Location Analysis Demo
Prototype demonstrating how to overlay data layers onto a map to identify locations of interest. In this map presentation we try to identify target communities in rural Ohio (Mid a
rurality
broadband coverage
higher education
new markets tax credit & opportunity zone tracts
factors 1 through 4 combined
Broadband availability across U.S. school districts
The rush to close schools across the country meant that some children were especially disadvantaged. As urban and suburban schools moved to virtual learning, their rural counterparts faced unique learning obstacles. In rural districts, students were quite literally disconnected from their schools because the infrastructure in their communities could not support virtual learning.
The broadband availability across U.S. school districts map illustrates how infrastructure limitations disproportionately impact students in rural communities. This interactive map shows broadband availability across America’s school districts, with broadband defined as internet service that:
Has download speeds of at least 25 Mbps
Has upload speeds of at least 3 Mbps
Is delivered by a fixed ground based system
This definition is based on Federal Communications Commission (FCC) benchmarks for broadband. To develop the map, we assumed that these are the bare minimum speed and reliability requirements for a household engaging in long-term remote work and learning. (Note: we do not count mobile internet or satellite internet as these services do not consistently offer the speed or reliability needed for extended remote work.)
Use this map to:
Better understand the urban/rural digital divide
Determine where the broadband infrastructure gap is most pronounced
Explore broadband availability by different variables, including community type and school district
Identifying rural employment risks created by COVID-19
Soon after the pandemic hit early in 2020, the Center on Rural Innovation team wondered what this additional layer of economic strife might do to rural communities. This led to the creation of an Employment Risk Index and an accompanying map.
Long before COVID-19 wreaked havoc on the health and economy of our country, rural America has been struggling. As tech jobs and opportunities abounded in urban areas, the industries that once employed many people in rural areas have long been declining. Digital infrastructure has also lagged, sending many young people to look for work outside of the places they grew up.
The index ranks counties by how vulnerable they are to losing jobs based on three factors relevant to the COVID crisis: employment in high-risk industries, employment in small businesses, and age of workforce. As this analysis in 2020 reveals, rural America was facing a disproportionately high risk in the immediate wake of COVID-19.
The County Risk Employment Map revealed the communities that were most at risk at this point in time, and many of those communities were rural, reaffirming the need to diversify industries in these parts of the country and build inclusive and resilient digital economies.
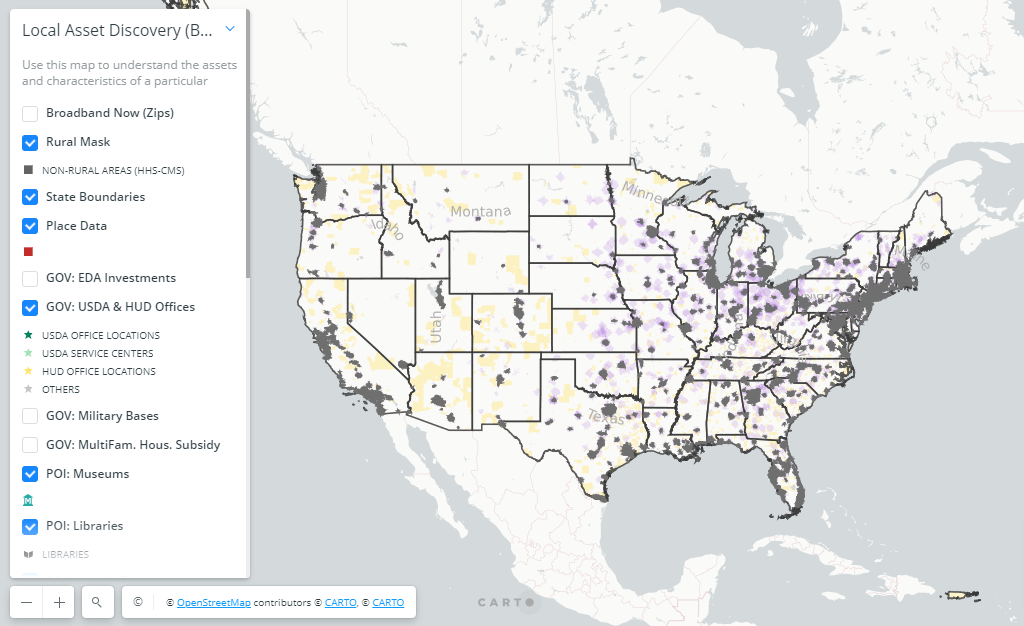
Surfacing rural assets
Small towns can leverage local assets that make these communities the kinds of places that digital economy workers and entrepreneurs want to live and work.
From the low cost of housing to outdoor amenities and beautiful downtowns, many factors are already in place in rural communities across the country. Combined with broadband infrastructure and a digital talent pipeline, certain communities are well positioned to promote innovation and entrepreneurship.
Our surfacing local assets map identifies necessary elements of inclusive digital economies, allowing for a targeted exploration of these assets in rural communities. As you zoom in on specific areas, the map reveals both clusters and the absence of different assets and institutions.
Use this map to:
Locate your own community and determine the assets that define it
Curate and compare the assets that define specific rural communities in your state
Identify places with key assets that drive digital economy ecosystems