COVID-19 County Preparedness Index
Awarded Fast Company Innovation by Design Finalist in Social Good and Honorable Mention in Health
Featured Carto.com article and webinar: Assessing Potential Impact of COVID-19 on Rural Communities
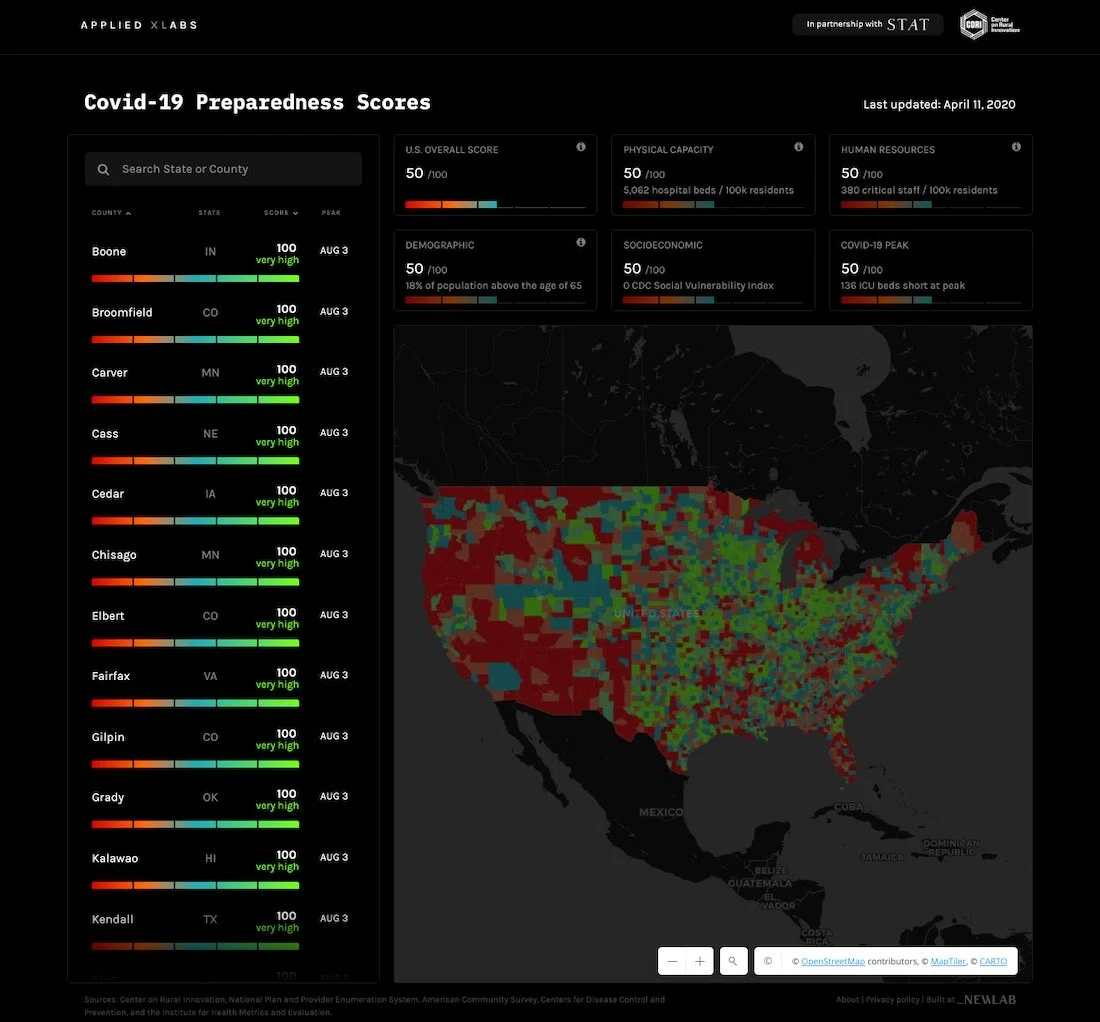
Partnered with Applied XL and health publication STAT to develop a global COVID-19 tracker and U.S. county preparedness index as a diagnostic response to the pandemic. This platform aggregated data on COVID-19 cases while also assessing pandemic preparedness in all counties country-wide. This tool was used by health journalists like STAT news, Business Insider, and experts world-wide to better understand the crisis.
Building the Solution
A number of data sets were used to determine the preparedness score of each US county including;
The number of licensed hospital beds within a 40-minute drive.
The number of critical care staff within a 40-minute drive.
The percentage of the population aged 65 and older.
The county's score on the Social Vulnerability Index.
Data from the University of Washington's Institute for Health Metrics and Evaluation's COVID-19 model.
Key Findings
The tool reveals that some rural areas are better prepared than others. Analysis from STAT found that:
“Portions of states like Vermont and New Hampshire and regions like the Midwest, for example, appear equipped to better handle the brunt of the outbreak than other rural communities. The dashboard also points to the places at higher risk. Some are areas where concerns have already been raised — including segments of the Deep South, where some governors were slow to implement physical distancing measures, and sparsely populated expanses in Western states outside larger cities. Others, like the Upper Peninsula of Michigan, which has suffered hospital closures, have received less attention.”
Additional Maps and Data Visualization Tools
We sat down with Rebekah Collinsworth, Communications Director at CORI who gave more details about the work they have been doing along with additional maps and data visualization tools they have published.
What were the motivations behind the development of the tool?
While our focus has been on how we can help rural communities recover economically through this pandemic, we do a lot of work with data and data visualization in rural places and recognized this as a time to expand the scope of our work to respond to what’s happening in rural America. When the partnership with STAT and Newlab presented itself, we knew it was an important project that would provide meaningful insights to areas of the country that would need it most. Making rural data available is important if we want them to be included in response and recovery efforts.
How do you hope the tool will be used to combat COVID-19 and aid in recovery efforts?
As with all our maps, we hope that people will use this as a tool to better understand and respond to what’s happening in rural America. Unfortunately, small towns and rural communities have the tendency to be overshadowed by what’s happening in urban areas, but we’re working to change that.
Throughout the pandemic, our mapping and data analytics team has used CARTO to create maps that provide greater clarity into the ways COVID-19 is affecting rural America. From maps identifying the school districts being impacted by the lack of broadband availability, to maps highlighting the counties facing significant employment risks, we are focused on providing insights into all areas of rural life.